Amazon_Food_Reviews
In this repository, I am practiced and implemented various machine learning algorithms using the real-world dataset amazon food reviews from Kaggle.
This project is maintained by Sachin-D-N
Amazon_Food_Reviews
In this repository, I am practiced and implemented various machine learning algorithms using the real-world dataset amazon food reviews from Kaggle.

Task 01. Amazon_Food_Reviews_Featurization
First We want to know What is Amazon Fine Food Review Analysis?
This dataset consists of reviews of fine foods from amazon. The data span a period of more than 10 years, including all ~500,000 reviews up to October 2012. Reviews include product and user information, ratings, and a plaintext review. We also have reviews from all other Amazon categories.
Amazon reviews are often the most publicly visible reviews of consumer products. As a frequent Amazon user, I was interested in examining the structure of a large database of Amazon reviews and visualizing this information so as to be a smarter consumer and reviewer.
Source: https://www.kaggle.com/snap/amazon-fine-food-reviews
Introduction
The Amazon Fine Food Reviews dataset consists of reviews of fine foods from Amazon.
- Number of reviews: 568,454
- Number of users: 256,059
- Number of products: 74,258
- Timespan: Oct 1999 — Oct 2012
- Number of Attributes/Columns in data: 10
Attribute Information:
- Id
- ProductId — unique identifier for the product
- UserId — unqiue identifier for the user
- ProfileName
- Helpfulness Numerator — number of users who found the review helpful
- HelpfullnessDenominator — number of users who indicated whether they found the review helpful or not
- Score — rating between 1 and 5
- Time — timestamp for the review
- Summary — brief summary of the review
- Text — text of the review
Objective
Given a review, determine whether the review is positive (Rating of 4 or 5) or negative (rating of 1 or 2).
[Q] How to determine if a review is positive or negative?
[Ans] We could use the Score/Rating. A rating of 4 or 5 could be cosnidered a positive review. A review of 1 or 2 could be considered negative. A review of 3 is nuetral and ignored. This is an approximate and proxy way of determining the polarity (positivity/negativity) of a review.
To Know the Complete overview of the Amazon Food review dataset and Featurization visit my medium blog
Task 02. Apply KNN to Amazon_Food_Reviews_Dataset

Apply Knn versions on these feature sets
- Review text, preprocessed one converted into vectors using (BOW)
- Review text, preprocessed one converted into vectors using (TFIDF)
- Review text, preprocessed one converted into vectors using (AVG W2v)
- Review text, preprocessed one converted into vectors using (TFIDF W2v)
KNN is a non-parametric and lazy learning algorithm. Non-parametric means there is no assumption for underlying data distribution. In other words, the model structure determined from the dataset. This will be very helpful in practice where most of the real-world datasets do not follow mathematical theoretical assumptions.
KNN is one of the most simple and traditional non-parametric techniques to classify samples. Given an input vector, KNN calculates the approximate distances between the vectors and then assign the points which are not yet labeled to the class of its K-nearest neighbors.
The lazy algorithm means it does not need any training data points for model generation. All training data used in the testing phase. This makes training faster and the testing phase slower and costlier. The costly testing phase means time and memory. In the worst case, KNN needs more time to scan all data points, and scanning all data points will require more memory for storing training data.
To Know how K-NN works visit my Medium blog here.
To Know detailed information about performance metrics used in Machine Learning please visit my Medium blog here.
After applying KNN algorithm to amazon food reviews data set we make below conclusions.
Conclusions
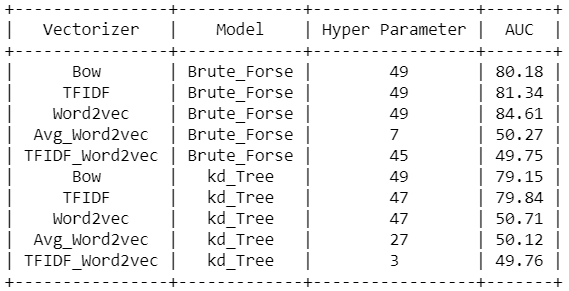
- From the above table, we can conclude the for all the text features best_K by Hyperparameter tuning is 49.
- From the above table, we observed that the K-NN simple brute model of Word2vec features having the highest AUC score of 84.61% on test data.
- The K-NN simple brute model of TF-IDF and Bag of words features also works reasonably well on test data having an AUC score of 81.34% and 80.18%.
- The Avg_Word2Vec and TFIDF_Word2vec are having a low AUC score on test data.
Task 03. Apply NaiveBayes to Amazon_Food_reviews_Dataset

Apply Multinomial NaiveBayes on these feature sets
- Review text, preprocessed one converted into vectors using (BOW)
- Review text, preprocessed one converted into vectors using (TFIDF)
Naive Bayes is a statistical classification technique based on Bayes Theorem. It is one of the simplest supervised learning algorithms. Naive Bayes classifier is a fast, accurate, and reliable algorithm. Naive Bayes classifiers have high accuracy and speed on large datasets.
Naive Bayes is the most straightforward and fast classification algorithm, which is suitable for a large chunk of data. Naive Bayes classifier is successfully used in various applications such as spam filtering, text classification, sentiment analysis, and recommender systems. It uses Bayes theorem of probability for prediction of unknown class.
Naive Bayes makes an assumption that features are conditionally independent. Theoretically, if the assumption does not hold true then the performance of NB degrades. But the research has shown that even if there is some feature dependency the Naive Bayes gives the best result.
To Know detailed information about NaiveBayes algorithm and implementation please visit my Medium blog
After applying Naive Bayes algorithm to amazon food reviews data set we make below conclusions.
Conclusions
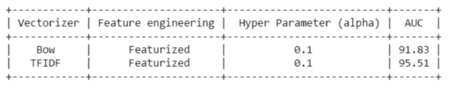
- Compare to Bag of words features representation, TFIDF features are got the highest 95.51% AUC score on Test data.
- Both are having 0.1 as the best alpha by Hyperparameter tuning.
- Both models have reasonably worked well for Amazon_food_reviews classification.
Task 04. Implementation_of_Stochastic_Gradient_Descent
Apply SGD Regressor from scratch
- Take the boston data set from sklearn.
- Write the SGDRegressor from scratch.
- You don’t need to split the data into train and test, you consider whole data for this implementation.
- Get weights( coefs_ and intercept ) from your model and the MSE value.
- Don’t forget to standardize the data, and choose appropriate learning rate.
- Train your model using SGDRegressor with the same parameters, and find the MSE on the same data.
- Compare these two results.
- You can choose any other metric other than MSE to compare them. They both should be same.
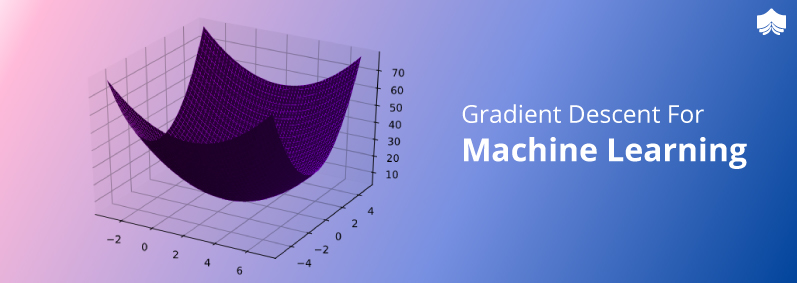
The solution to an optimization problem can be done by selecting different methods. Moreover, the user can navigate on the surface or curve to establish an initial point and find the optimal or critical point, which can be observed on the plotted function.
Some functions are very complex to solve, so the computer science technique to solve those types of functions is the Gradient descent algorithm.
Gradient descent is an optimization algorithm that is mainly used to find the minimum of a function. In machine learning, gradient descent is used to update parameters in a model. Parameters can vary according to the algorithms.
To Know detailed information about Gradient_Descent and implementation please visit my Medium blog
After applying Gradient_Descent algorithm to boston data set we make below conclusions.
Conclusions
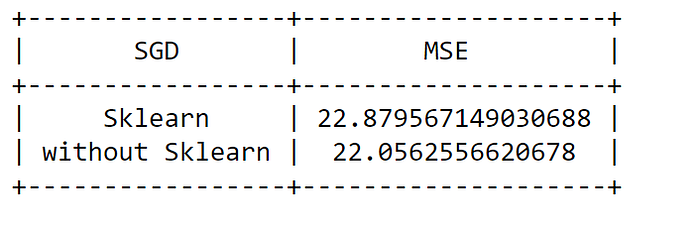
As from the above, we can see that mean of the differences in the prediction of the two models is at 0 As we can see above intercept and weight(coef) is almost same for sklearn SGD and self-implemented SGD.
Task 05. Apply Logistic_Regression to Amazon_Food_Reviews_Dataset

Apply Logistic Regression on these feature sets
- Review text, preprocessed one converted into vectors using (BOW)
- Review text, preprocessed one converted into vectors using (TFIDF)
- Review text, preprocessed one converted into vectors using (AVG W2v)
- Review text, preprocessed one converted into vectors using (TFIDF W2v)
Logistic regression is a classification algorithm used to assign observations to a discrete set of classes. There are lots of classification problems that are available, but the logistics regression is common and is a useful regression method for solving the binary classification problem.
There are lots of classification problems that are available, but the logistics regression is common and is a useful regression method for solving the binary classification problem.
Logistic Regression is one of the most simple and commonly used Machine Learning algorithms for two-class classification. It is easy to implement and can be used as the baseline for any binary classification problem.
Its basic fundamental concepts are also constructive in deep learning. Logistic regression describes and estimates the relationship between one dependent binary variable and independent variables.
To Know detailed information about Logistic_Regression and implementation please visit my Medium blog
After applying Logistic_Regression algorithm to Amazon_food_reviews data set we make below conclusions.
Conclusions
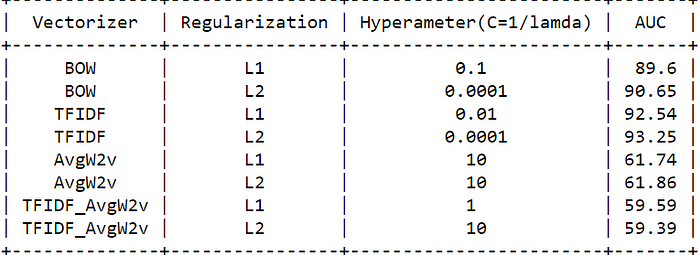
- Compare to Bag of words features representation, TFIDF features with L2 Regularization are getting the highest 93.25% AUC score on Test data.
- The C values are different from model to model.
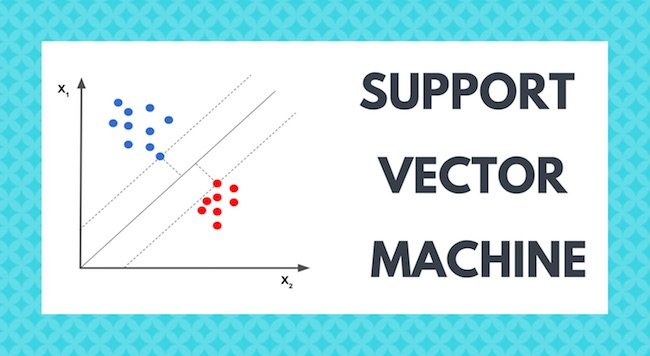
Task 06. Apply Support_Vector_Machines to Amazon_Food_Reviews_Dataset
Apply SVM on these feature sets
- Review text, preprocessed one converted into vectors using (BOW)
- Review text, preprocessed one converted into vectors using (TFIDF)
- Review text, preprocessed one converted into vectors using (AVG W2v)
- Review text, preprocessed one converted into vectors using (TFIDF W2v)
SVM is a supervised Machine Learning algorithm that is used in many classifications and regression problems. It still presents as one of the most used robust prediction methods that can be applied to many use cases involving classifications.
Logistic Regression doesn’t care whether the instances are close to the decision boundary. Therefore, the decision boundary it picks may not be optimal. If a point is far from the decision boundary, we may be more confident in our predictions.Therefore, the optimal decision boundary should be able to maximize the distance between the decision boundary and all instances. i.e., maximize the margins. That’s why the SVMs algorithm is important!Find a Hyperplane that separates Positive points from Negative points as wide as possible.
The support vector machine works by finding an optimal separation line called a ‘hyperplane’ to accurately separate 2 or more different classes in a classification problem. The goal is to find the optimal hyperplane separation through training the linearly separable data with the SVM algorithm.
To Know detailed information about Support Vector Machines and implementation please visit my Medium blog
After applying Support Vector Machines algorithm to Amazon_food_reviews data set we make below conclusions.
Conclusions
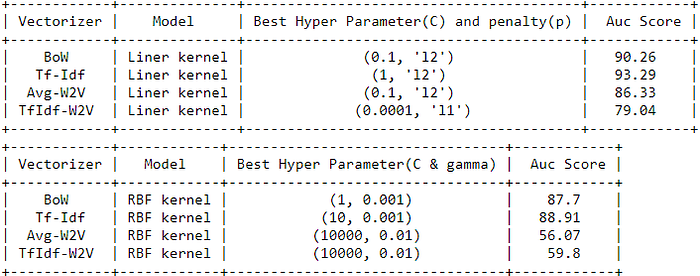
- Compare to Bag of words features representation, TFIDF features with L2 Regularization are getting the highest 93.29% AUC score on Test data.
- The C and Gamma values are different from model to model.
Task 07. Apply Decision_Tree to Amazon_Food_Reviews_Dataset

Apply Decision Trees on these feature sets
- Review text, preprocessed one converted into vectors using (BOW)
- Review text, preprocessed one converted into vectors using (TFIDF)
- Review text, preprocessed one converted into vectors using (AVG W2v)
- Review text, preprocessed one converted into vectors using (TFIDF W2v)
Decision trees are a popular supervised learning method for a variety of reasons. The benefits of decision trees include that they can be used for both regression and classification, they are easy to interpret and they don’t require feature scaling. They have several flaws including being prone to overfitting.
Decision trees which are also modernly known as classification and regression trees (CART) were introduced by Leo Breiman to refer, Decision Tree algorithms. They have a supervised learning algorithm that has a pre-defined target variable & they are mostly used in non-linear decision making with a simple linear decision surface. In other words, they are adaptable for solving any kind of problem at hand (classification or regression).
One of the best and most used supervised learning methods are tree-based algorithms. They empower predictive modeling with higher accuracy, better stability, and provide ease of interpretation. Unlike linear modeling techniques, they map non-linear relationships quite well. Methods like decision trees, random forest, gradient boosting are being popularly used in all kinds of data science problems. Hence, for every analyst, it’s important to learn these algorithms and apply them at the time of modeling.
To Know detailed information about Decision Tree and implementation please visit my Medium blog
After applying Decision Tree algorithm to Amazon_food_reviews data set we make below conclusions.
Conclusions
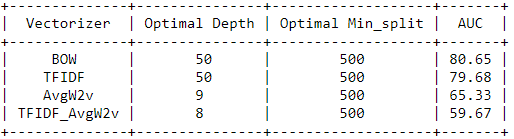
- Compare to all other features representation, Bag of words features with Depth of 50 and min_split of 500 are getting the highest 80.65% AUC scores on Test data.
- The optimal Depth and Min_split values from Grid_search_CV are different from model to model.
Task 08. Apply Random_Forest to Amazon_Food_Reviews_Dataset

Apply Random Forests & GBDT on these feature sets
- Review text, preprocessed one converted into vectors using (BOW)
- Review text, preprocessed one converted into vectors using (TFIDF)
- Review text, preprocessed one converted into vectors using (AVG W2v)
- Review text, preprocessed one converted into vectors using (TFIDF W2v)
Commonly, the individual model suffers from bias or variances and that’s why we need ensemble learning.
An Ensemble method is a technique that combines the predictions from multiple machine learning algorithms together to make more accurate predictions than any individual model. A model comprised of many models is called an Ensemble model.
Random forest is a Supervised Learning algorithm that uses an ensemble learning method for classification and regression.
Random forest is a bagging technique. The trees in random forests are run in parallel. There is no interaction between these trees while building the trees.
It operates by constructing a multitude of decision trees at training time and outputting the class that is the mode of the classes (classification) or mean prediction (regression) of the individual trees.
A random forest is a meta-estimator (i.e. it combines the result of multiple predictions) which aggregates many decision trees, with some helpful modifications.
To Know detailed information about Ensemble models and implementation please visit my Medium blog
After applying Random Forest algorithm to Amazon_food_reviews data set we make below conclusions.
Conclusions
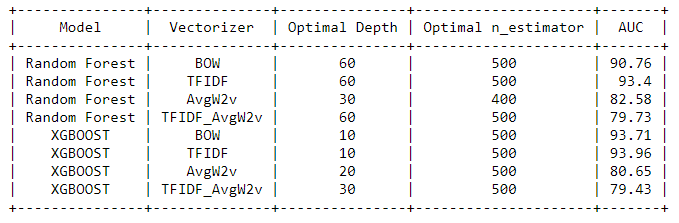
- From the above table, we conclude that TFIDF in Random Forest with an optimal depth of 60 and optimal estimator of 500 have the Highest AUC score i.e 93.40 %.
- xgboost also TFIDF with an optimal depth of 10 and optimal estimator of 500 have the Highest AUC score i.e 93.96 %.
- Both Random Forest and xgboost models have performed reasonably well on Test data.
Task 09. Apply Clustering_Analysis to Amazon_Food_Reviews_Dataset

Apply Clustering Techniques on these feature sets:
- Review text, preprocessed one converted into vectors using (BOW)
- Review text, preprocessed one converted into vectors using (TFIDF)
- Review text, preprocessed one converted into vectors using (AVG W2v)
- Review text, preprocessed one converted into vectors using (TFIDF W2v)
- Find the best ‘k’ using the elbow-knee method (plot k vs inertia_)
- Once after you find the k clusters, plot the word cloud per each cluster so that at a single go we can analyze the words in a cluster.
Clustering is a Machine Learning technique that involves the grouping of data points. Given a set of data points, we can use a clustering algorithm to classify each data point into a specific group. In theory, data points that are in the same group should have similar properties and/or features, while data points in different groups should have highly dissimilar properties and/or features. Clustering is a method of unsupervised learning and is a common technique for statistical data analysis used in many fields.
In Data Science, we can use clustering analysis to gain some valuable insights from our data by seeing what groups the data points fall into when we apply a clustering algorithm.
Clustering Methods :
-
Density-Based Methods : These methods consider the clusters as the dense region having some similarity and different from the lower dense region of the space. These methods have good accuracy and ability to merge two clusters.Example DBSCAN (Density-Based Spatial Clustering of Applications with Noise) , OPTICS (Ordering Points to Identify Clustering Structure) etc.
- Hierarchical Based Methods : The clusters formed in this method forms a tree-type structure based on the hierarchy. New clusters are formed using the previously formed one. It is divided into two category
- Agglomerative (bottom up approach)
- Divisive (top down approach)
-
Partitioning Methods : These methods partition the objects into k clusters and each partition forms one cluster. This method is used to optimize an objective criterion similarity function such as when the distance is a major parameter example K-means, CLARANS (Clustering Large Applications based upon Randomized Search) etc.
- Grid-based Methods : In this method the data space is formulated into a finite number of cells that form a grid-like structure. All the clustering operation done on these grids are fast and independent of the number of data objects example STING (Statistical Information Grid), wave cluster, CLIQUE (CLustering In Quest) etc.
To Know detailed information about Clustering methods please visit here
Wordclouds of clusters obtained after applying Clustering methods


After applying Clustering Methods to Amazon_food_reviews data set we make below conclusions.
Conclusions

-
For K means clustering we applied k-means for different value of k and selected optimal k with the help of elbow method from graph between inertia vs k.
-
We sorted out top 5 features in each clusters of Bow and TFIDF vectorize.
-
For agglomerative clustering we took n_clusters=[2,3] and applied algorithm on it and plotted the word cloud for each clusters.
-
And at the end we applied DBSCAN on Avg-W2vec and TFIDF-W2vec, for optimal eps we first calculated the nth distance from each point, sorted them and plotted the curve between points and distances and the again we applied elbow method to figure out the best eps(At point of inflexion).
Task 10. Apply Truncated_SVD to Amazon_Food_Reviews_Datasets
Apply Truncated-SVD on only this feature set
- Review text, preprocessed one converted into vectors using (TFIDF)
Linear algebra bridges the gap between theory and practical implementation of concepts. A healthy understanding of linear algebra opens doors to machine learning algorithms we thought were impossible to understand. And one such use of linear algebra is in Singular Value Decomposition (SVD) for dimensionality reduction.
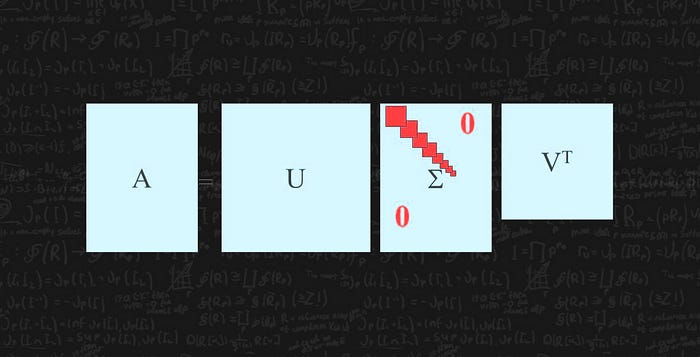
Singular vectors & singular values
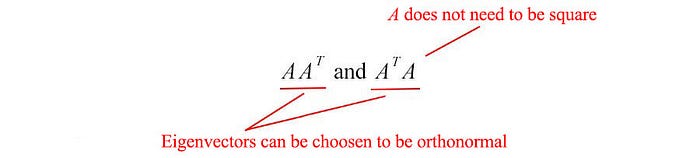
The matrix AAᵀ and AᵀA are very special in linear algebra.Consider any m × n matrix A, we can multiply it with Aᵀ to form AAᵀ and AᵀA separately. These matrices are
- symmetrical
- square
- at least positive semidefinite (eigenvalues are zero or positive),
- both matrices have the same positive eigenvalues, and
- both have the same rank r as A.
In addition, the covariance matrices that we often use in ML are in this form. Since they are symmetric, we can choose its eigenvectors to be orthonormal (perpendicular to each other with unit length).
Let’s introduce some terms that frequently used in SVD. We name the eigenvectors for AAᵀ as uᵢ and AᵀA as vᵢ here and call these sets of eigenvectors u and v the singular vectors of A. Both matrices have the same positive eigenvalues. The square roots of these eigenvalues are called singular values.
Not too many explanations so far but let’s put everything together first and the explanations will come next. We concatenate vectors uᵢ into U and vᵢ into V to form orthogonal matrices.
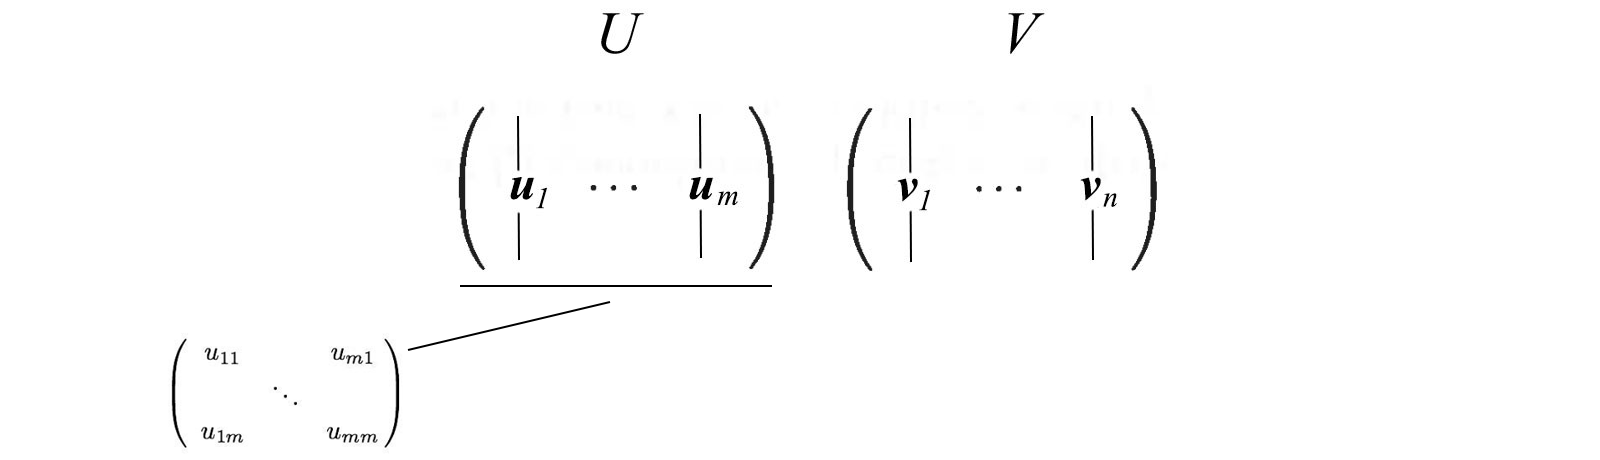
Since these vectors are orthonormal, it is easy to prove that U and V obey

Applications of Singular Value Decomposition (SVD)
- Image Compression
- Image Recovery
- Eigenfaces
- Spectral Clustering
- Background Removal from Videos
To Know detailed information about SVD please visit here
Observations and Conclusions
-
First we figured our top 3000 words using tfidf score built a co-occurence matrix from those words
-
After applying truncated svd on it we found our optimal n_components to be 49 since it covers 99.50% of explained variance obtained.
-
Then we applied kmeans on using optimal svd values and found our best n_cluster value equal to 3 using elbow method.

- After that we plotted wordcloud for each clusters and found in some clusters there are few words and at the end we generated a function which return most similar words using cosine similarity of co-occurence matrix.

Task 11. Amazon_Food_Reviews_Model_Deployment

Building a machine learning project is one thing but what matters at the end is how you show your project to the world. Documenting your whole project on GitHub is another thing but deploying your deep learning model as a web application is totally different gameball.
In order for Machine Learning Engineers to succeed at work, they need to build services such that other teams can use or a product where people can use it directly. Essentially, the goal is to provide a model as a service and for that there is a concept called API. API is the way for computer systems to talk to each other over Internet Protocols. They act as an agent which takes information from the user to the server and then again from server to the user giving back the answer. Flask provides that capability. Flask will act as an API between your model and the HTML file.
We begin by creating a project folder where we define all dependencies in the requirements.txt file. To ensure that all dependencies are isolated from our application, we create a virtual environment for our working space.
To deploy we want to train our model and save the outputs in a pickle file and these pickle files are used for predict the new reiews in production.
Steps
- Create GitHub Repository (optional)
- Create and Pickle a Model Using Titanic Data.
- Create Flask App.
- Test Flask App Locally (optional)
- Deploy to Heroku.
- Test Working App.
Results
Positive Reviews

Negative Reviews

I am deployed app in Heroku Platform to see visit here